
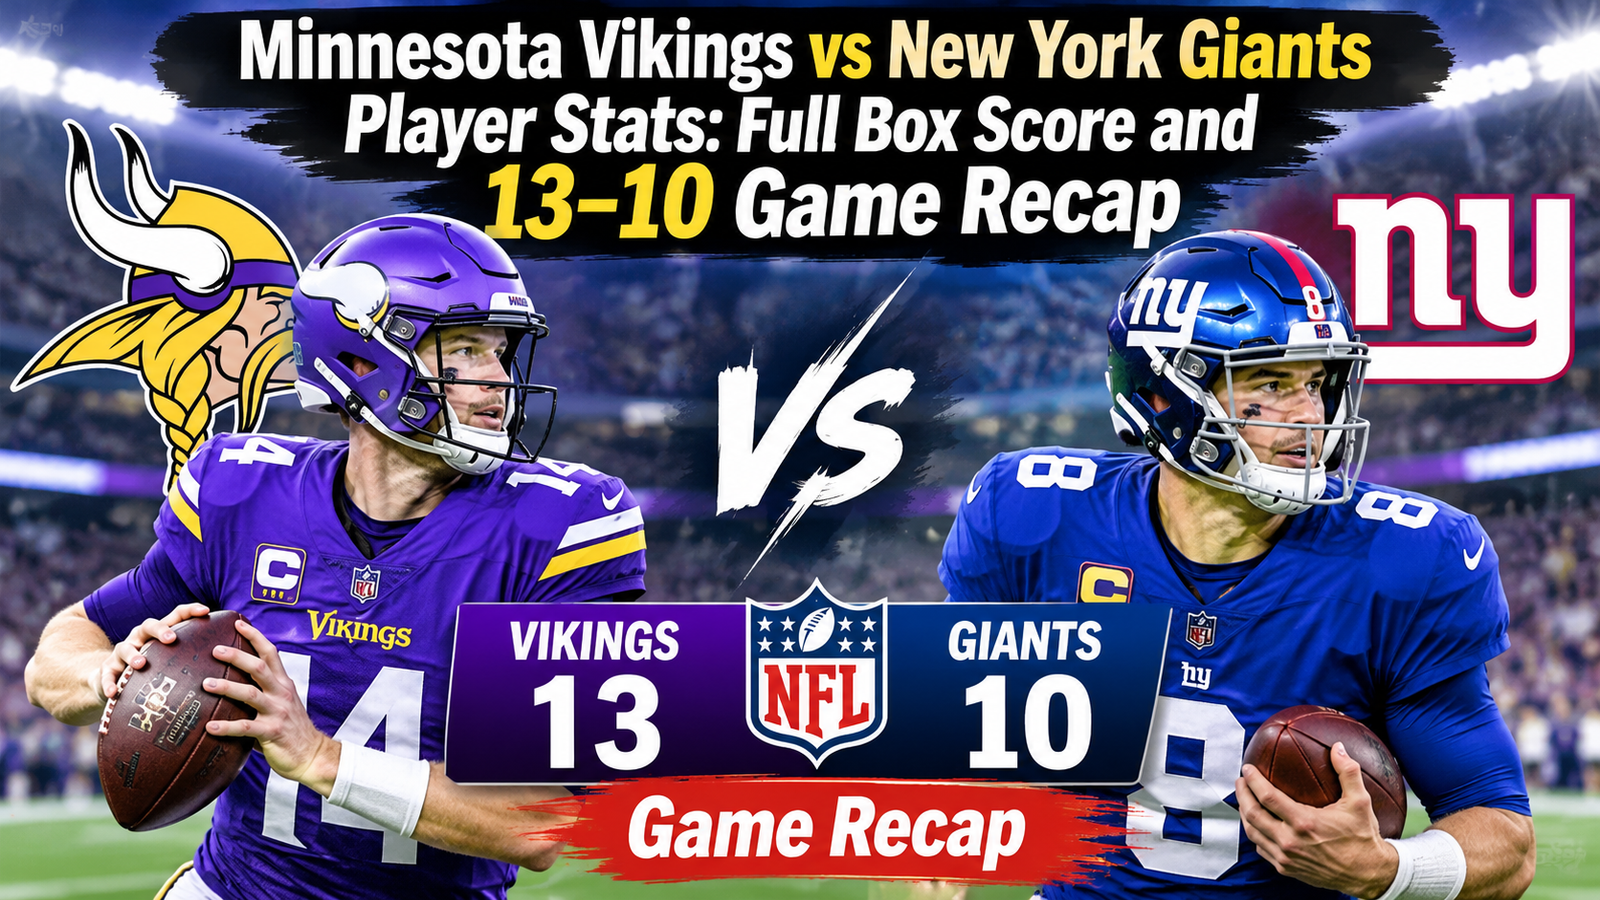
The Minnesota Vikings defeated the New York Giants 13–10 on August 15, 2026, at MetLife Stadium in East Rutherford, New Jersey. The preseason contest was decided by a third-quarter touchdown pass from Carson Wentz to Myles Price, while Minnesota’s defense made two important interceptions to protect the narrow lead.
The game featured contrasting offensive performances. Jameis Winston led New York in passing yards with 89, while Wentz finished with 81 yards and Minnesota’s only passing touchdown. Price was the leading receiver of the game with 51 receiving yards and a touchdown. The Vikings also established a stronger rushing attack, finishing with 111 yards compared with the Giants’ 70.
For readers searching for Minnesota Vikings vs New York Giants player stats, this breakdown covers the quarterbacks, rushing leaders, receiving performances, defensive contributions, team statistics, and scoring sequence that shaped Minnesota’s preseason victory.
Minnesota Vikings vs New York Giants Match Overview
The Vikings and Giants entered the preseason matchup looking to evaluate their players and establish momentum ahead of the regular season. Although preseason results do not count toward regular-season standings, the contest offered a useful look at individual performances and team depth.
New York started strongly and held a 10–3 advantage at halftime. Minnesota responded in the third quarter with a field goal and a touchdown, turning a seven-point deficit into a three-point lead.
The Vikings’ defense played an important role in the outcome. Minnesota intercepted two passes, avoided throwing an interception of its own, and recorded four sacks. These defensive contributions helped the team maintain its advantage through a scoreless fourth quarter.
Match Details
| Match Information | Details |
| Teams | Minnesota Vikings vs New York Giants |
| Date | August 15, 2026 |
| Competition | NFL Preseason |
| Week | Preseason Week 1 |
| Venue | MetLife Stadium |
| Location | East Rutherford, New Jersey |
| Final score | Vikings 13–10 Giants |
| Winning team | Minnesota Vikings |
| Winning margin | 3 points |
Minnesota Vikings vs New York Giants Full Box Score
The final score tells only part of the story. Minnesota produced more total yards and rushing yards, while New York generated more gross passing yards.
| Team Statistics | Vikings | Giants |
| Final score | 13 | 10 |
| Total net yards | 238 | 201 |
| Gross passing yards | 131 | 160 |
| Net passing yards | 127 | 131 |
| Rushing yards | 111 | 70 |
| Rushing attempts | 27 | 27 |
| Passing completions | 16 | 16 |
| Passing attempts | 26 | 21 |
| First downs | 15 | 11 |
| Third-down conversions | 4/12 | 5/13 |
| Total turnovers | 0 | 2 |
| Sacks recorded | 4 | 1 |
| Time of possession | 29:27 | 30:33 |
| Penalties | 7 | 7 |
The comparison reveals why Minnesota won despite New York producing more gross passing yards. The Vikings gained 41 more rushing yards, recorded four additional first downs, and protected the football more effectively.
The turnover difference was particularly significant. Minnesota finished without a turnover, while the Giants threw two interceptions. Those lost possessions made it harder for New York to build on its early scoring advantage.
Minnesota Vikings Passing Stats
Minnesota used four quarterbacks during the game, giving several players an opportunity to demonstrate their passing ability. Carson Wentz delivered the most productive performance, throwing for 81 yards and one touchdown.
Vikings Quarterback Statistics
| Quarterback | Completions/Attempts | Passing Yards | TD | INT |
| Carson Wentz | 9/14 | 81 | 1 | 0 |
| J.J. McCarthy | 4/7 | 34 | 0 | 0 |
| Kyler Murray | 2/3 | 10 | 0 | 0 |
| Max Brosmer | 1/2 | 6 | 0 | 0 |
| Team Total | 16/26 | 131 | 1 | 0 |
Carson Wentz Leads Minnesota’s Passing Attack
Carson Wentz was Minnesota’s leading passer, completing nine of 14 attempts for 81 yards. He recorded one touchdown and avoided an interception.
His most important contribution came in the third quarter when he connected with Myles Price for a one-yard touchdown. That play gave Minnesota the lead after the Vikings had trailed for much of the first half.
Wentz did not need an exceptionally high passing total to make an impact. His touchdown connection came at a crucial point in the game and helped turn Minnesota’s second-half comeback into a winning result.
J.J. McCarthy’s Performance
J.J. McCarthy completed four of seven passes for 34 yards without throwing a touchdown or interception.
His appearance provided another opportunity for Minnesota to evaluate its quarterback depth. Although his passing total was lower than Wentz’s, his contribution formed part of the Vikings’ overall offensive production.
Kyler Murray and Max Brosmer
Kyler Murray completed two of three attempts for 10 yards, while Max Brosmer completed one of two passes for six yards.
Both quarterbacks had limited opportunities. Their statistics should therefore be considered in the context of their small workloads rather than treated as a complete assessment of their abilities.
New York Giants Passing Stats
New York’s quarterback group produced 160 gross passing yards, exceeding Minnesota’s 131. However, the Giants were unable to turn that passing advantage into a winning performance.
Jameis Winston led the team in passing yards, while Jaxson Dart delivered New York’s only touchdown pass.
Giants Quarterback Statistics
| Quarterback | Completions/Attempts | Passing Yards | TD | INT |
| Jameis Winston | 8/9 | 89 | 0 | 0 |
| Jaxson Dart | 3/4 | 26 | 1 | 0 |
| Brandon Allen | 5/8 | 45 | 0 | 2 |
| Team Total | 16/21 | 160 | 1 | 2 |
Jameis Winston Records the Most Passing Yards
Jameis Winston completed eight of nine passes for 89 yards. His completion percentage was approximately 88.9%, making him New York’s most productive quarterback by passing yardage.
Winston did not throw a touchdown or interception during his appearance. His accuracy helped the Giants move the ball, although his individual passing performance did not translate into a victory.
Jaxson Dart Connects With Malachi Fields
Jaxson Dart completed three of four passes for 26 yards and one touchdown.
His most important play was a 15-yard touchdown pass to Malachi Fields in the second quarter. The scoring connection helped New York take a 7–3 lead and provided one of the game’s most important offensive moments for the Giants.
Brandon Allen’s Two Interceptions
Brandon Allen completed five of eight attempts for 45 yards but threw two interceptions.
Those interceptions were especially costly because Minnesota’s defense converted both mistakes into takeaways. Although Allen contributed passing yards, the turnovers reduced New York’s ability to protect its advantage.
Minnesota Vikings Rushing Stats
Minnesota finished with 111 rushing yards on 27 attempts, averaging 4.1 yards per carry. The Vikings used several players in the running game rather than relying on one dominant performance.
Vikings Rushing Leaders
| Player | Carries | Rushing Yards | Average |
| Demond Claiborne | 12 | 34 | 2.8 |
| Aaron Jones Sr. | 3 | 27 | 9.0 |
| Dillon Bell | 2 | 27 | 13.5 |
| Jordan Mason | 3 | 17 | 5.7 |
| Zavier Scott | 2 | 6 | 3.0 |
| J.J. McCarthy | 1 | 1 | 1.0 |
| J. Jefferson | 3 | 0 | 0.0 |
| Carson Wentz | 1 | -1 | -1.0 |
| Team Total | 27 | 111 | 4.1 |
Demond Claiborne Handles the Largest Workload
Demond Claiborne led Minnesota in rushing attempts, carrying the ball 12 times for 34 yards.
His 12 carries represented the largest workload among the Vikings’ listed runners. Although his average was 2.8 yards per attempt, his involvement gave Minnesota a consistent rushing option throughout the game.
Aaron Jones and Dillon Bell Produce Efficient Runs
Aaron Jones Sr. recorded 27 yards on three carries, averaging nine yards per attempt. His longest run covered 18 yards.
Dillon Bell also finished with 27 rushing yards, but he needed only two attempts. His average of 13.5 yards per carry highlighted the effectiveness of his limited opportunities.
These performances helped Minnesota generate rushing production from multiple players and finish with a substantial advantage over New York on the ground.
New York Giants Rushing Stats
The Giants finished with 70 rushing yards on 27 attempts, averaging 2.6 yards per carry.
Eric Gray led New York in rushing yardage, while Cameron Skattebo and Dante Miller also contributed to the ground attack.
Giants Rushing Leaders
| Player | Carries | Rushing Yards |
| Eric Gray | 8 | 20 |
| Cameron Skattebo | 4 | 19 |
| Dante Miller | 5 | 14 |
| Other runners | 10 | 17 |
| Team Total | 27 | 70 |
Eric Gray Leads the Giants
Eric Gray finished with 20 rushing yards on eight carries, making him New York’s leading rusher.
Cameron Skattebo added 19 yards on four attempts, while Dante Miller contributed 14 yards on five carries.
The Giants’ rushing production was less effective than Minnesota’s. Their 70-yard total was 41 yards below the Vikings’ output, and the difference contributed to Minnesota’s advantage in overall offensive yardage.
Receiving Stats: Myles Price Leads All Players
Myles Price was the standout receiver of the matchup, finishing with four receptions for 51 yards and one touchdown.
His touchdown catch from Wentz proved decisive, but his receiving production throughout the game also made him Minnesota’s leading target by yardage.
Minnesota Vikings Receiving Leaders
| Player | Receptions | Receiving Yards | TD |
| Myles Price | 4 | 51 | 1 |
| Jeshaun Jones | 1 | 17 | 0 |
| Other receivers | — | — | — |
Myles Price Delivers the Decisive Touchdown
Price’s performance was one of the biggest individual highlights of the game.
He caught four passes for 51 yards, including a one-yard touchdown reception in the third quarter. The scoring play gave Minnesota a 13–10 advantage after Will Reichard converted the extra point.
Price’s ability to contribute both receiving yardage and a touchdown made him one of the most influential players on the field.
New York Giants Receiving Leaders
| Player | Receptions | Receiving Yards | TD |
| Devin Singletary | 1 | 40 | 0 |
| Malachi Fields | 3 | 34 | 1 |
| Dalen Cambre | 1 | 20 | 0 |
| Other receivers | — | — | — |
Devin Singletary produced New York’s longest notable receiving contribution, gaining 40 yards on one reception.
Malachi Fields caught three passes for 34 yards and scored the Giants’ only touchdown. His 15-yard scoring reception from Dart helped New York establish its second-quarter lead.
The receiving comparison shows two different types of impact. Price combined four receptions with a touchdown, while Singletary created a significant gain on a single catch.
Defensive Player Stats: Interceptions and Sacks
Minnesota’s defensive performance was central to the victory. The Vikings recorded two interceptions and four sacks, putting pressure on New York’s passing attack and preventing the Giants from protecting their early lead.
Key Defensive Performers
| Player | Team | Defensive Contribution |
| Jacob Roberts | Vikings | 1 interception, 3 tackles |
| Jacob Thomas | Vikings | 1 interception, 4 tackles |
| Dallas Turner | Vikings | 1 sack |
| Bo Richter | Vikings | 1 sack |
| Jay Ward | Vikings | 1 sack |
| Elijah Williams | Vikings | 1 sack |
| Darius Alexander | Giants | 1 sack |
| James Pierre | Vikings | 6 total tackles |
| Jack Kelly | Giants | 5 total tackles |
Jacob Roberts and Jacob Thomas Record Interceptions
Jacob Roberts and Jacob Thomas each intercepted a New York pass.
These defensive plays were important because they prevented the Giants from maintaining possession and creating additional scoring opportunities.
Roberts finished with three tackles, while Thomas recorded four tackles alongside his interception. Their contributions helped Minnesota maintain control of the game after taking the lead.
Vikings Spread Their Pass-Rushing Production
Minnesota recorded four sacks, with Dallas Turner, Bo Richter, Jay Ward, and Elijah Williams each contributing one.
Having four different players record a sack demonstrated the depth of the Vikings’ defensive pressure. New York, meanwhile, recorded one sack through Darius Alexander.
James Pierre Leads in Tackles
James Pierre recorded six total tackles, including four solo stops, making him the leading tackler in the reported defensive statistics.
Jack Kelly led the Giants with five total tackles. Both players contributed to their respective defensive units, although Minnesota’s interceptions and additional sacks made the difference in the game’s defensive statistics.
Quarter-by-Quarter Scoring Summary
The game developed through three scoring quarters, with neither team managing to add points in the fourth.
First Quarter: Minnesota Takes an Early Lead
Minnesota opened the scoring with a 35-yard field goal from Will Reichard.
The kick gave the Vikings a 3–0 advantage and provided an early opportunity to establish control.
Second Quarter: Giants Move Ahead 10–3
New York responded with a touchdown from Jaxson Dart to Malachi Fields. The 15-yard pass was followed by Ben Sauls’ successful extra point.
The Giants later added a 46-yard field goal from Sauls, taking a 10–3 lead into halftime.
Third Quarter: Minnesota Completes the Comeback
Minnesota began its comeback with another field goal from Reichard, this time from 54 yards.
The Vikings then produced the game’s decisive scoring play. Wentz connected with Price for a one-yard touchdown, and Reichard converted the extra point.
That sequence put Minnesota ahead 13–10.
Fourth Quarter: Vikings Protect Their Lead
Neither team scored in the final quarter.
Minnesota maintained its three-point advantage, and the Vikings completed their preseason victory with a 13–10 final score.
Final Score by Quarter
| Quarter | Minnesota Vikings | New York Giants |
| First | 3 | 0 |
| Second | 0 | 10 |
| Third | 10 | 0 |
| Fourth | 0 | 0 |
| Final | 13 | 10 |
What Decided Minnesota’s 13–10 Victory?
Several statistical differences explain how Minnesota secured the win despite New York recording more gross passing yards.
1. Better ball security
Minnesota finished without an interception, while the Giants threw two. Protecting possession was a major advantage for the Vikings.
2. More effective rushing production
The Vikings gained 111 rushing yards compared with New York’s 70. This gave Minnesota a 41-yard advantage on the ground.
3. Important defensive takeaways
Jacob Roberts and Jacob Thomas each recorded an interception. Those plays helped Minnesota limit the Giants’ opportunities to add points.
4. Price’s game-winning touchdown
The Wentz-to-Price connection in the third quarter turned a 10–6 deficit into a 13–10 lead. It ultimately became the decisive scoring play.
5. Consistent kicking
Will Reichard converted both of his field-goal attempts and the extra point. His contributions accounted for seven of Minnesota’s 13 points.
Key Takeaways From the Vikings vs Giants Match
The statistical comparison offers several useful conclusions:
- Minnesota won despite producing fewer gross passing yards.
- The Vikings had the advantage in total net yards and rushing yards.
- Jameis Winston led all quarterbacks with 89 passing yards.
- Carson Wentz threw the decisive touchdown pass.
- Myles Price led the receiving statistics with 51 yards and one touchdown.
- Malachi Fields scored New York’s only touchdown.
- Minnesota recorded two interceptions and four sacks.
- Neither team scored in the fourth quarter.
Because this was a preseason game, these numbers should be understood as one-game performances rather than evidence of a player’s entire regular-season ability.
Frequently Asked Questions
1. Who won the Minnesota Vikings vs New York Giants game?
The Minnesota Vikings won 13–10 against the New York Giants on August 15, 2026, during the NFL preseason.
2. What was the final score of the Vikings vs Giants game?
Minnesota finished with 13 points, while New York scored 10. The Vikings secured a three-point victory.
3. Which quarterback had the most passing yards?
Jameis Winston led all quarterbacks with 89 passing yards, completing eight of nine attempts for the Giants. Carson Wentz led Minnesota with 81 passing yards.
4. Who was the leading receiver in the game?
Myles Price was the leading receiver, recording four receptions for 51 yards and one touchdown for Minnesota.
5. Who scored the touchdowns for Minnesota and New York?
Myles Price scored Minnesota’s touchdown on a one-yard pass from Carson Wentz. Malachi Fields scored New York’s touchdown on a 15-yard reception from Jaxson Dart.
6. How many rushing yards did the Vikings and Giants record?
Minnesota finished with 111 rushing yards on 27 attempts, while New York recorded 70 rushing yards on the same number of attempts.
7. How many interceptions did Minnesota record?
The Vikings recorded two interceptions. Jacob Roberts and Jacob Thomas each contributed one takeaway.
8. Where was the Minnesota Vikings vs New York Giants game played?
The game took place at MetLife Stadium in East Rutherford, New Jersey, on August 15, 2026.
Conclusion
The Minnesota Vikings vs New York Giants player stats reveal how a close preseason matchup was decided by a combination of offensive production and defensive execution. Minnesota’s 13–10 victory came despite New York producing more gross passing yards, showing that passing volume alone does not determine the outcome of a football game.
Carson Wentz supplied the decisive touchdown pass, Myles Price led the receiving attack, and the Vikings’ rushing unit generated 111 yards. On defense, Jacob Roberts and Jacob Thomas each recorded an interception, while four different Minnesota players contributed a sack.
For New York, Jameis Winston delivered the highest passing-yardage total, Malachi Fields scored a touchdown, and Devin Singletary produced a 40-yard reception. However, the Giants’ two interceptions and lower rushing output proved costly.
Ultimately, Minnesota’s ability to protect the football, generate defensive pressure, and capitalize on a crucial third-quarter scoring opportunity made the difference in its three-point preseason win.
